|
5.10 CAPACITY PLANNING
Design of the production system involves planning for the inputs, conversion process and outputs
of production operation. The effective management of capacity is the most important responsibility
of production management. The objective of capacity management (i.e., planning and control of
capacity) is to match the level of operations to the level of demand.
Capacity planning is to be carried out keeping in mind future growth and expansion plans,
market trends, sales forecasting, etc. It is a simple task to plan the capacity in case of stable
demand. But in practice the demand will be seldom stable. The fluctuation of demand creates
problems regarding the procurement of resources to meet the customer demand. Capacity decisions
|
 are strategic in nature. Capacity is the rate of productive capability of a facility. Capacity is
usually expressed as volume of output per period of time.
Production managers are more concerned about the capacity for the following reasons:
_ Sufficient capacity is required to meet the customers demand in time.
_ Capacity affects the cost efficiency of operations.
_ Capacity affects the scheduling system.
_ Capacity creation requires an investment.
Capacity planning is the first step when an organization decides to produce more or new
products.
5.10.1 Measurement of Capacity Planning
The capacity of the manufacturing unit can be expressed in number of units of output per period.
In some situations measuring capacity is more complicated when they manufacture multiple
products. In such situations, the capacity is expressed as man-hours or machine hours. The
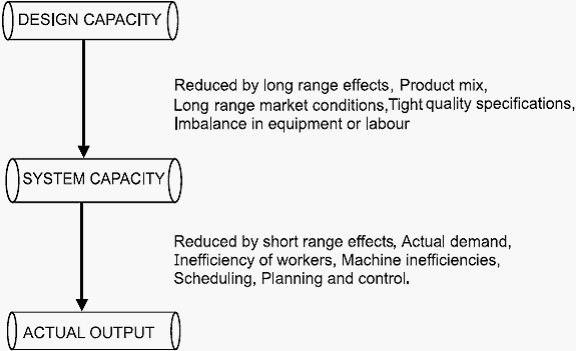
relationship between capacity and output is shown in Fig. 5.6.
1. Design capacity: Designed capacity of a facility is the planned or engineered rate of
output of goods or services under normal or full scale operating conditions.
For example, the designed capacity of the cement plant is 100 TPD (Tonnes per day).
Capacity of the sugar factory is 150 tonnes of sugarcane crushing per day.
2. System capacity: System capacity is the maximum output of the specific product or
product mix the system of workers and machines is capable of producing as an integrated whole.
System capacity is less than design capacity or at the most equal, because of the limitation of
product mix, quality specification, breakdowns. The actual is even less because of many factors
affecting the output such as actual demand, downtime due to machine/equipment failure,
unauthorised absenteeism.
Fig. 5.6 Capacity and output relationship
|
|
_________
___
_
_ _
_ __
____
___
The system capacity is less than design capacity because of long range uncontrollable
factors. The actual output is still reduced because of short-term effects such as, breakdown of
equipment, inefficiency of labour. The system efficiency is expressed as ratio of actual measured
output to the system capacity.
System Efficiency (SE) =
Actual output
System capacity
3. Licensed capacity: Capacity licensed by the various regulatory agencies or government
authorities. This is the limitation on the output exercised by the government.
4. Installed capacity: The capacity provided at the time of installation of the plant is called
installed capacity.
5. Rated capacity: Capacity based on the highest production rate established by actual trials
is referred to as rated capacity.
5.10.2 Process of Capacity Planning
Capacity planning is concerned with defining the long-term and the short-term capacity needs of
an organization and determining how those needs will be satisfied. Capacity planning decisions
are taken based upon the consumer demand and this is merged with the human, material and
financial resources of the organization.
Capacity requirements can be evaluated from two perspectives—long-term capacity strategies
and short-term capacity strategies.
1. LONG-TERM CAPACITY STRATEGIES
Long-term capacity requirements are more difficult to determine because the future demand and
technology are uncertain. Forecasting for five or ten years into the future is more risky and
difficult. Even sometimes company’s today’s products may not be existing in the future. Long
range capacity requirements are dependent on marketing plans, product development and
lifecycle
of the product. Long-term capacity planning is concerned with accommodating major
changes that affect overall level of the output in long-term. Marketing environmental assessment
and implementing the long-term capacity plans in a systematic manner are the major
responsibilities
of management. Following parameters will affect long range capacity decisions.
1. Multiple products: Company’s produce more than one product using the same facilities
in order to increase the profit. The manufacturing of multiple products will reduce the risk of
failure. Having more than one product helps the capacity planners to do a better job. Because
products are in different stages of their life-cycles, it is easy to schedule them to get maximum
capacity utilisation.
2. Phasing in capacity: In high technology industries, and in industries where technology
developments are very fast, the rate of obsolescence is high. The products should be brought into
the market quickly. The time to construct the facilities will be long and there is no much time as
the products should be introduced into the market quickly. Here the solution is phase in capacity
on modular basis. Some commitment is made for building funds and men towards facilities over
a
period of 3–5 years. This is an effective way of capitalising on technological breakthrough.
3. Phasing out capacity: The outdated manufacturing facilities cause excessive plant
|
|
closures and down time. The impact of closures is not limited to only fixed costs of plant and
machinery. Thus, the phasing out here is done with humanistic way without affecting the
community.
The phasing out options makes alternative arrangements for men like shifting them to other jobs
or to other locations, compensating the employees, etc.
2. SHORT-TERM CAPACITY STRATEGIES
Managers often use forecasts of product demand to estimate the short-term workload the facility
must handle. Managers looking ahead up to 12 months, anticipate output requirements for
different
products, and services. Managers then compare requirements with existing capacity and then
take decisions as to when the capacity adjustments are needed.
For short-term periods of up to one year, fundamental capacity is fixed. Major facilities will
not be changed. Many short-term adjustments for increasing or decreasing capacity are possible.
The adjustments to be required depend upon the conversion process like whether it is capital
intensive or labour intensive or whether product can be stored as inventory.
Capital intensive processes depend on physical facilities, plant and equipment. Short-term
capacity can be modified by operating these facilities more or less intensively than normal. In
labour intensive processes short-term capacity can be changed by laying off or hiring people or
by giving overtime to workers. The strategies for changing capacity also depend upon how long
the product can be stored as inventory.
The short-term capacity strategies are:
1. Inventories: Stock of finished goods during slack periods to meet the demand during
peak period.
2. Backlog: During peak periods, the willing customers are requested to wait and their
orders are fulfilled after a peak demand period.
3. Employment level (hiring or firing): Hire additional employees during peak demand
period and layoff employees as demand decreases.
4. Employee training: Develop multi-skilled employees through training so that they can
be rotated among different jobs. The multi-skilling helps as an alternative to hiring employees.
5. Subcontracting: During peak periods, hire the capacity of other firms temporarily to
make the component parts or products.
6. Process design: Change job contents by redesigning the job.
5.11 ROUTING
Routing may be defined as the selection of path which each part of the product will follow while
being transformed from raw materials to finished products. Path of the product will also give
sequence of operation to be adopted while being manufactured.
In other way, routing means determination of most advantageous path to be followed from
department to department and machine to machine till raw material gets its final shape, which
involves the following steps:
(a) Type of work to be done on product or its parts.
(b) Operation required to do the work.
(c) Sequence of operation required
.
|
|
_________
___
_
_ _
_ __
____
___
(d) Where the work will be done.
(e) A proper classification about the personnel required and the machine for doing the work.
For effective production control of a well-managed industry with standard conditions, the
routing plays an important role, i.e., to have the best results obtained from available plant
capacity. Thus routing provides the basis for scheduling, dispatching and follow-up.
5.11.1 Techniques of Routing
While converting raw material into required goods different operations are to be performed and
the selection of a particular path of operations for each piece is termed as ‘Routing’. This
selection of a particular path, i.e. sequence of operations must be the best and cheapest to have
the lowest cost of the final product. The various routing techniques are:
1. Route card: This card always accompanies with the job throughout all operations. This
indicates the material used during manufacturing and their progress from one operation to
another. In addition to this the details of scrap and good work produced are also recorded.
2. Work sheet: It contains
(a) Specifications to be followed while manufacturing.
(b) Instructions regarding routing of every part with identification number of machines and
work place of operation.
This sheet is made for manufacturing as well as for maintenance.
3. Route sheet: It deals with specific production order. Generally made from operation
sheets. One sheet is required for each part or component of the order. These includes the following:
(a) Number and other identification of order.
(b) Symbol and identification of part.
(c) Number of pieces to be made.
(d) Number of pieces in each lot—if put through in lots.
(e) Operation data which includes:
(i) List of operation on the part.
(ii) Department in which operations are to be performed.
(iii) Machine to be used for each operation.
(iv) Fixed sequence of operation, if any.
(f) Rate at which job must be completed, determined from the operation sheet.
4. Move order: Though this is document needed for production control, it is never used
for routing system. Move order is prepared for each operation as per operation sheet. On this
the quantity passed forward, scrapped and to be rectified are recorded. It is returned
to planning office when the operation is completed.
5.12 SCHEDULING
Scheduling can be defined as “prescribing of when and where each operation necessary to
manufacture the product is to be performed.”
It is also defined as “establishing of times at which to begin and complete each event or
|
|
__
_________
_
_ ________
__
_____
_
operation comprising a procedure”. The principle aim of scheduling is to plan the sequence of
work so that production can be systematically arranged towards the end of completion of all
products by due date.
5.12.1 Principles of Scheduling
1. The principle of optimum task size: Scheduling tends to achieve maximum efficiency
when the task sizes are small, and all tasks of same order of magnitude.
2. Principle of optimum production plan: The planning should be such that it imposes an
equal load on all plants.
3. Principle of optimum sequence: Scheduling tends to achieve the maximum efficiency
when the work is planned so that work hours are normally used in the same sequence.
5.12.2 Inputs to Scheduling
1. Performance standards: The information regarding the performance standards (standard
times for operations) helps to know the capacity in order to assign required machine
hours to the facility.
2. Units in which loading and scheduling is to be expressed.
3. Effective capacity of the work centre.
4. Demand pattern and extent of flexibility to be provided for rush orders.
5. Overlapping of operations.
6. Individual job schedules.
5.12.3 Scheduling Strategies
Scheduling strategies vary widely among firms and range from ‘no scheduling’ to very sophisticated
approaches.
These strategies are grouped into four classes:
1. Detailed scheduling: Detailed scheduling for specific jobs that are arrived from customers
is impracticable in actual manufacturing situation. Changes in orders, equipment breakdown, and
unforeseen events deviate the plans.
2. Cumulative scheduling: Cumulative scheduling of total work load is useful especially
for long range planning of capacity needs. This may load the current period excessively and under
load future periods. It has some means to control the jobs.
3. Cumulative detailed: Cumulative detailed combination is both feasible and practical
approach. If master schedule has fixed and flexible portions.
4. Priority decision rules: Priority decision rules are scheduling guides that are used
independently and in conjunction with one of the above strategies, i.e., first come first serve.
These are useful in reducing Work-In-Process (WIP) inventory.
|
 _________
___
_
_ _
_ __
____
__
5.12.4 Types of Scheduling
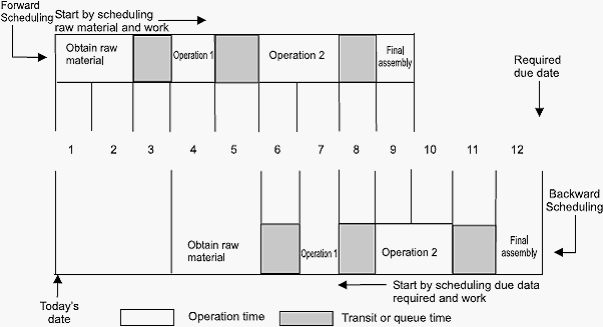
Types of scheduling can be categorized as forward scheduling and backward scheduling.
1. Forward scheduling is commonly used in job shops where customers place their orders
on “needed as soon as possible” basis. Forward scheduling determines start and finish times of
next priority job by assigning it the earliest available time slot and from that time, determines
when the job will be finished in that work centre. Since the job and its components start as early
as possible, they will typically be completed before they are due at the subsequent work centres
in the routing. The forward method generates in the process inventory that are needed at
subsequent work centres and higher inventory cost. Forward scheduling is simple to use and it
gets jobs done in shorter lead times, compared to backward scheduling.
2. Backward scheduling is often used in assembly type industries and commit in advance
to specific delivery dates. Backward scheduling determines the start and finish times for waiting
jobs by assigning them to the latest available time slot that will enable each job to be completed
just when it is due, but done before. By assigning jobs as late as possible, backward scheduling
minimizes inventories since a job is not completed until it must go directly to the next work centre
on its routing. Forward and backward scheduling methods are shown in Fig. 5.7.
Fig. 5.7 Forward and backward scheduling
5.13 SCHEDULING METHODOLOGY
The scheduling methodology depends upon the type of industry, organization, product, and level
of sophistication required. They are:
1.
Charts and boards,
|
|
___ _________
_
_ ________
__
_____
_
2. Priority decision rules, and
3. Mathematical programming methods.
1. Gantt Charts and Boards
Gantt charts and associated scheduling boards have been extensively used scheduling devices in
the past, although many of the charts are now drawn by computer. Gantt charts are extremely
easy to understand and can quickly reveal the current or planned situation to all concerned. They
are used in several forms, namely,
(a) Scheduling or progress charts, which depicts the sequential schedule;
(b) Load charts, which show the work assigned to a group of workers or machines; and
(c) Record a chart, which are used to record the actual operating times and delays of
workers and machines.
2. Priority Decision Rules
Priority decision rules are simplified guidelines for determining the sequence in which jobs will
be done. In some firms these rules take the place of priority planning systems such as MRP
systems. Following are some of the priority rules followed.
Symbol Priority rule
FCFS First come, first served
EDO Earliest due date
LS Least slack (that is, time due less processing time)
SPT Shortest processing time
LPT Longest processing time
PCO Preferred customer order
RS Random selection
3. Mathematical Programming Methods
Scheduling is a complex resource allocation problem. Firms process capacity, labour skills, materials
and they seek to allocate their use so as to maximize a profit or service objective, or perhaps
meet a demand while minimizing costs.
The following are some of the models used in scheduling and production control.
(a) Linear programming model: Here all the constraints and objective functions are
formulated as a linear equation and then problem is solved for optimality. Simplex method,
transportation methods and assignment method are major methods used here.
(b) PERT/CPM network model: PERT/CPM network is the network showing the sequence
of operations for a project and the precedence relation between the activities to be completed.
Note: Scheduling is done in all the activities of an organisation i.e., production, maintenance etc. Therefore,
all the methods and techniques of scheduling is used for maintenance management (Ref. Chapter 8).
|
|
_________
___
_
_ _
_ __
____
___
EXERCISES
Section A
1. What do you mean by production planning and control?
2. What do you mean by aggregate planning?
3. What is master production schedule?
4. What is material requirement planning?
5. What is capacity planning?
6. What is routing?
7. What is scheduling?
8. Mention the types of scheduling.
Section B
1. Why do you need production planning and control?
2. What are the objective of production planning and control?
3.
What are the guidelines for aggregate planning?
4. Explain the functions of master production schedule.
5.
Explain the objective of MRP.
6. How do you measure capacity?
7. Explain the techniques of routing.
8. What are the inputs to scheduling?
9. Explain the scheduling strategies.
Section C
1. Discuss the phases of production planning and control.
2. Discuss the functions of PP & C.
3. Discuss the operations planning and scheduling systems.
4. Discuss the aggregate plan and master schedule.
5. Discuss the MRP system.
6. Discuss the process of capacity planning.
7. Discuss the scheduling methods.
Skill Development
FAST FOOD RESTAURANT VISIT: Get the information for the following questions:
1. Phase of production planning and production control.
2. Planning for the demand fluctuation.
3. Items are prepared to order or with forecast.
4. Procedures to manufacture pizza.
5. Scheduling the orders (i.e. first come first schedule or largest proceeding time and shortest
proceeding time etc.)
|
 ___ _________
_
_ ________
__
_____
_
CASELET
ESCOM-COPING WITH RUNWAY
CAPACITY NEEDS
ESCOM is a producer of electronic home appliances, including VHS (Video Home System)
television recorders, located in northern California. The packaged product weighs about 75 kg.
ESCOM was not the innovator of the system. Rather, its managers sat back and let RCA and
others develop the market, and ESCOM is currently producing under license agreements. ESCOM
has a conscious strategy of being a follower with new product innovations. It does not have the
financial resources to be a leader in research and development.
ESCOM’s present opportunity is indicated by the fact that industry sales of VHS recorders
have increased 30 per cent per year for the past two years, and forecasts for the next year and
the two following are even more enticing. ESCOM has established a 10 per cent market share
position and feels that it can at least maintain this position if it has the needed capacity; it could
possibly improve its market share if competitors fail to provide capacity at the time it is needed.
Year
The forecasts and capacity gaps are indicated in Table. ESCOM regards the first year
forecast as being quite solid, based on its present market share and a compilation of several
industry forecasts from different sources. It is less sure about the forecasts for future years, but
it is basing these forecasts on patterns for both black and white and color TV sales during their
product life cycles.
ESCOM’s VHS model has a factory price of Rs 600. Variable costs are 70 percent of the
price. Inventory carrying costs are 20 per cent of inventory value, 15 percentage points of which
represents the cost of capital. ESCOM’s facility planners estimate that a 40,000 unit plant can
be built for Rs. 5 million and a 200,00 unit plant, for Rs. 10 million. Land and labour are available
in the area, and either size plant can be built within a year.
(a) What capacity plans do you think ESCOM should make for next year? Why?
(b) What longer-term capacity plans should ESCOM make? Why?
(c) What are the implications of these plans for marketing, distribution, and production?
[Source: Modern Production/Operations Management by Elwood S.Buffa & Rakesh K.Sarin]
|
|
CHAPTER OUTLINE
131
QUALITY CONTROL
6.1 Introduction
6.2 Quality
6.3 Control
6.4 Inspection
6.5 Quality Control
6.6 Statistical Process Control
6
6.7 Quality Circles
6.8 Total Quality Management (TQM)
6.9 ISO 9000 Series
6.10 Appliation ISO 9000: ISO 14000 Series
• Exercises
• Skill Development
• Caselet
6.1 INTRODUCTION
In any business organization, profit is the ultimate goal. To achieve this, there are several
approaches. Profit may be maximized by cutting costs for the same selling price per unit. If it
is a monopolistic business, without giving much of importance to the cost reduction programs, the
price may be fixed suitably to earn sufficient profit. But, to survive in a competitive business
environment, goods and services produced by a firm should have the minimum required quality.
Extra quality means extra cost. So, the level of quality should be decided in relation to other
factors such that the product is well absorbed in the market. In all these cases, to have repeated
sales and thereby increased sales revenue, basic quality is considered to be one of the supportive
factors. Quality is a measure of how closely a good or service conforms to specified standard.
Quality standards may be any one or a combination of attributes and variables of the product
being manufactured. The attributes will include performance, reliability, appearance, commitment
to delivery time, etc., variables may be some measurement variables like, length, width, height,
diameter, surface finish, etc.
|
|
Most of the above characteristics are related to products. Similarly, some of the quality
characteristics of services are meeting promised due dates, safety, comfort, security, less waiting
time and so forth. So, the various dimensions of quality are performance, features, reliability,
conformance, durability, serviceability, aesthetics, perceived quality, safety, comfort, security,
commitment to due dates, less waiting time, etc.
6.2 QUALITY
Different meaning could be attached to the word quality under different circumstances. The word
quality does not mean the quality of manufactured product only. It may refer to the quality of
the process (i.e., men, material, and machines) and even that of management. Where the quality
manufactured product referred as or defined as “Quality of product as the degree in which it
fulfills the requirement of the customer. It is not absolute but it judged or realized by comparing
it with some standards”.
Quality begins with the design of a product in accordance with the customer specification
further it involved the established measurement standards, the use of proper material, selection
of suitable manufacturing process etc., quality is a relative term and it is generally used with
reference to the end use of the product.
Crosby defined as “Quality is conformance to requirement or specifications”.
Juran defined as “Quality is fitness for use”. “The Quality of a product or service is the
fitness of that product or service for meeting or exceeding its intended use as required by the
customer.”
6.2.1 Fundamental Factors Affecting Quality
The nine fundamental factors (9 M’s), which are affecting the quality of products and services,
are: markets, money, management, men, motivation, materials, machines and mechanization.
Modern information methods and mounting product requirements.
1. Market: Because of technology advancement, we could see many new products to
satisfy customer wants. At the same time, the customer wants are also changing dynamically.
So, it is the role of companies to identify needs and then meet it with existing technologies or
by developing new technologies.
2. Money: The increased global competition necessitates huge outlays for new equipments
and process. This should be rewarded by improved productivity. This is possible by minimizing
quality costs associated with the maintenance and improvements of quality level.
3. Management: Because of the increased complex structure of business organization, the
quality related responsibilities lie with persons at different levels in the organization.
4. Men: The rapid growth in technical knowledge leads to development of human resource
with different specialization. This necessitates some groups like, system engineering group to
integrate the idea of full specialization.
|
|
_______ __
____
___
5. Motivation: If we fix the responsibility of achieving quality with each individual in the
organization with proper motivation techniques, there will not be any problem in producing the
designed quality products.
6. Materials: Selection of proper materials to meet the desired tolerance limit is also an
important consideration. Quality attributes like, surface finish, strength, diameter etc., can be
obtained by proper selection of material.
7. Machines and mechanization: In order to have quality products which will lead to
higher productivity of any organization, we need to use advanced machines and mechanize
various operations.
8. Modern information methods: The modern information methods help in storing and
retrieving needed data for manufacturing, marketing and servicing.
9. Mounting product requirements: Product diversification to meet customers taste leads
to intricacy in design, manufacturing and quality standards. Hence, companies should plan adequate
system to tackle all these requirements.
6.3 CONTROL
The process through which the standards are established and met with standards is called control.
This process consists of observing our activity performance, comparing the performance with
some standard and then taking action if the observed performance is significantly too different
from the standards.
The control process involves a universal sequence of steps as follows:
1. Choose the control object
2. Choose a unit of measure
3. Set the standard value
4. Choose a sensing device which can measure
5. Measure actual performance
6. Interpret the difference between actual and standard
7. Taking action.
6.3.1 Need for Controlling Quality
In the absence of quality, the following will result:
1. No yardstick for comparing the quality of goods/services.
2. Difficulty in maintaining consistency in quality.
3. Dissatisfied customers due to increased maintenance and operating costs of products/services.
4. Increased rework cost while manufacturing products/providing services.
5. Reduced life time of the products/services.
6. Reduced flexibility with respect to usage of standard spare parts.
7. Hence, controlling quality is an essential activity.
|
|
6.4 INSPECTION
Inspection is an important tool to achieve quality concept. It is necessary to assure confidence
to manufacturer and aims satisfaction to customer. Inspection is an indispensable tool of modern
manufacturing process. It helps to control quality, reduces manufacturing costs, eliminate scrap
losses and assignable causes of defective work.
The inspection and test unit is responsible for appraising the quality of incoming raw materials
and components as well as the quality of the manufactured product or service. It checks the
components at various stages with reference to certain predetermined factors and detecting and
sorting out the faulty or defective items. It also specified the types of inspection devices to use
and the procedures to follow to measure the quality characteristics.
Inspection only measures the degree of conformance to a standard in the case of variables.
In the case of attributes inspection merely separates the nonconforming from the conforming.
Inspection does not show why the nonconforming units are being produced.
Inspection is the most common method of attaining standardization, uniformity and quality of
workmanship. It is the cost art of controlling the production quality after comparison with the
established standards and specifications. It is the function of quality control. If the said item does
not fall within the zone of acceptability it will be rejected and corrective measure will be applied
to see that the items in future conform to specified standards.
6.4.1 Objectives of Inspection
1. To detect and remove the faulty raw materials before it undergoes production.
2. To detect the faulty products in production whenever it is detected.
3. To bring facts to the notice of managers before they become serous to enable them
discover weaknesses and over the problem.
4. To prevent the substandard reaching the customer and reducing complaints.
5. To promote reputation for quality and reliability of product.
6.4.2 Purpose of Inspection
1. To distinguish good lots from bad lots.
2. To distinguish good pieces from bad pieces.
3. To determine if the process is changing.
4. To determine if the process is approaching the specification limits.
5. To rate quality of product.
6. To rate accuracy of inspectors.
7. To measure the precision of the measuring instrument.
8. To secure products-design information.
9. To measure process capability.
|
|
6.4.3 Types of Inspection
Types of inspection are:
1. Floor inspection 2. Centralized inspection
3. Combined inspection 4. Functional inspection
5. First piece inspection 6. Pilot piece inspection
7. Final inspection
1. F
LOOR
I
NSPECTION
In this system, the inspection is performed at the place of production. It suggests the checking of
materials in process at the machine or in the production time by patrolling inspectors. These
inspectors move from machine to machine and from one to the other work centres. Inspectors have
to be highly skilled. This method of inspection minimize the material handling, does not disrupt the
line layout of machinery and quickly locate the defect and readily offers field and correction.
Advantages
1. Detection of errors of the source reduces scrap and rework.
2. Correction is done before it affects further production, resulting in saving cost of
unnecessary work on defective parts.
3. Material handling time is reduced.
4. Job satisfaction to worker as he can’t be held responsible for bad work at a later date.
5. Greater number of pieces can be checked than a sample size.
6. Does not delay in production.
Disadvantages
1. Delicate instruments can be employed.
2. Measuring or inspection equipment have to be recalibrated often as they are subjected
to wear or dust.
3. High cost of inspection because of numerous sets of inspections and skilled inspectors.
4. Supervision of inspectors is difficult due to vibration.
5. Pressure on inspector.
6. Possibility of biased inspection because of worker.
Suitability
1. Heavy products are produced.
2. Different work centres are integrated in continuous line layout.
2. CENTRALISED INSPECTION
Inspection is carried in a central place with all testing equipment, sensitive equipment is housed
in air-conditioned area. Samples are brought to the inspection floor for checking. Centralised
inspection may locate in one or more places in the manufacturing industry.
|
|
___ _________
_
_ ________
__
_____
_
Advantages
1. Greater degree of inspection due to sensitive equipment.
2. Less number of inspectors and tools.
3. Equipment needs less frequency of recalibration.
4. Cost of inspection is reduced.
5. Unbiased inspection.
6. Supervision of inspectors made possible.
7. No distraction to the inspector.
Disadvantages
1. Defects of job are not revealed quickly for prevention.
2. Greater material handling.
3. High cost as products are subjected to production before they are prevented.
4. Greater delay in production.
5. Inspection of heavy work not possible.
6. Production control work is more complicated.
7. Greater scrap.
3. COMBINED INSPECTION
Combination of two methods whatever may be the method of inspection, whether floor or central.
The main objective is to locate and prevent defect which may not repeat itself in subsequent
operation to see whether any corrective measure is required and finally to maintain quality
economically.
4. F
UNCTIONAL
I
NSPECTION
This system only checks for the main function, the product is expected to perform. Thus an
electrical motor can be checked for the specified speed and load characteristics. It does not
reveal the variation of individual parts but can assure combined satisfactory performance of all
parts put together. Both manufacturers and purchasers can do this, if large number of articles
are needed at regular intervals. This is also called assembly inspection.
5. FIRST PIECE OR FIRST-
OFF
I
NSPECTIONS
First piece of the shift or lot is inspected. This is particularly used where automatic machines are
employed. Any discrepancy from the operator as machine tool can be checked to see that the
product is within in control limits. Excepting for need for precautions for tool we are check and
disturbance in machine set up, this yields good result if the operator is careful.
6. P
ILOT
P
IECE
I
NSPECTION
This is done immediately after new design or product is developed. Manufacturer of product is done
either on regular shop floor if production is not disturbed. If production is affected to a large extent,
the product is manufactured in a pilot plant. This is suitable for mass production and products involving
large number of components such as automobiles aeroplanes etc., and modification are design or
manufacturing process is done until satisfactory performance is assured or established.
|
|
_______ __
____
___
7. F
INAL
I
NSPECTION
This is also similar to functional or assembly inspection. This inspection is done only after completion
of work. This is widely employed in process industries where there is not possible such as,
electroplating or anodizing products. This is done in conjunction with incoming material inspection.
6.4.4 Methods of Inspection
There are two methods of inspection. They are: 100% inspection and sampling inspection.
1. 100% I
NSPECTION
This type will involve careful inspection in detail of quality at each strategic point or stage of
manufacture where the test is involved is non-destructive and every piece is separately inspected.
It requires more number of inspectors and hence it is a costly method. There is no sampling error.
This is subjected to inspection error arising out of fatigue, negligence, difficulty of supervision etc.
Hence, completer accuracy of influence is seldom attained. It is suitable only when a small
number of pieces are there or a very high degree of quality is required. Example: Jet engines,
aircraft, medical and scientific equipment.
2. S
AMPLING
I
NSPECTION
In this method randomly selected samples are inspected. Samples taken from different patches
of products are representatives. If the sample proves defective, the entire concerned is to be
rejected or recovered. Sampling inspection is cheaper and quicker. It requires less number of
Inspectors. It is subjected to sampling errors but the magnitude of sampling error can be estimated.
In the case of destructive test, random or sampling inspection is desirable. This type of inspection
governs wide currency due to the introduction of automatic machines or equipments which are
less susceptible to chance variable and hence require less inspection, suitable for inspection of
products which have less precision importance and are less costly. Example: Electrical bulbs,
radio bulbs, washing machine etc.
6.4.5 Drawbacks of Inspection
Following are the disadvantages of inspection:
1. Inspection adds to the cost of the product but not for its value.
2. It is partially subjective, often the inspector has to judge whether a products passes or
not.
3. Fatigue and Monotony may affect any inspection judgment.
4. Inspection merely separates good and bad items. It is no way to prevent the production
of bad items.
6.5 QUALITY CONTROL
Quality Control (QC) may be defined as a system that is used to maintain a desired level of
quality in a product or service. It is a systematic control of various factors that affect the quality
of the product. It depends on materials, tools, machines, type of labour, working conditions etc.
|
|
___ _________
_
_ ________
__
_____
_
QC is a broad term, it involves inspection at particular stage but mere inspection does not mean
QC. As opposed to inspection, in quality control activity emphasis is placed on the quality future
production. Quality control aims at prevention of defects at the source, relies on effective
feedback system and corrective action procedure. Quality control uses inspection as a valuable tool.
According to Juran “Quality control is the regulatory process through which we measure
actual quality performance, compare it with standards, and act on the difference”. Another
definition of quality control is from ANSI/ASQC standard (1978) quality control is defined as
“The operational techniques and the activities which sustain a quality of product or service that
will satisfy given needs; also the use of such techniques and activities”.
Alford and Beatty define QC as “In the broad sense, quality control is the mechanism by
which products are made to measure up to specifications determined from customers, demands
and transformed into sales engineering and manufacturing requirements, it is concerned with
making things right rather than discovering and rejecting those made wrong”.
6.5.1 Types of Quality Control
QC is not a function of any single department or a person. It is the primary responsibility of any
supervisor to turn out work of acceptable quality. Quality control can be divided into three main
sub-areas, those are:
1. Off-line quality control, 2. Statistical process control, and 3. Acceptance sampling plans.
1. Off-line quality control: Its procedure deal with measures to select and choose
controllable product and process parameters in such a way that the deviation between the
product or process output and the standard will be minimized. Much of this task is accomplished
through product and process design.
Example: Taguchi method, principles of experimental design etc.
2. Statistical process control: SPC involves comparing the output of a process or a
service with a standard and taking remedial actions in case of a discrepancy between the two.
It also involves determining whether a process can produce a product that meets desired
specification or requirements. On-line SPC means that information is gathered about the product,
process, or service while it is functional. The corrective action is taken in that operational phase.
This is real-time basis.
3. Acceptance sampling plans: A plan that determines the number of items to sample and
the acceptance criteria of the lot, based on meeting certain stipulated conditions (such as the risk
of rejecting a good lot or accepting a bad lot) is known as an acceptance sampling plan.
6.5.2 Steps in Quality Control
Following are the steps in quality control process:
1. Formulate quality policy.
2. Set the standards or specifications on the basis of customer’s preference, cost and profit.
3. Select inspection plan and set up procedure for checking.
4. Detect deviations from set standards of specifications.
5. Take corrective actions or necessary changes to achieve standards.
|
|
_______ __
____
__
6. Decide on salvage method i.e., to decide how the defective parts are disposed of, entire
scrap or rework.
7. Coordination of quality problems.
8. Developing quality consciousness both within and outside the organization.
9. Developing procedures for good vendor-vendee relations.
6.5.3 Objectives of Quality Control
Following are the objectives of quality control:
1. To improve the companies income by making the production more acceptable to the
customers, i.e., by providing long life, greater usefulness, maintainability etc.
2. To reduce companies cost through reduction of losses due to defects.
3. To achieve interchangeability of manufacture in large scale production.
4. To produce optimal quality at reduced price.
5. To ensure satisfaction of customers with productions or services or high quality level, to
build customer goodwill, confidence and reputation of manufacturer.
6. To make inspection prompt to ensure quality control.
7. To check the variation during manufacturing.
The broad areas of application of quality control are incoming material control, process
control and product control.
6.5.4 Benefits of Quality Control
_
Improving the quality of products and services.
_
Increasing the productivity of manufacturing processes, commercial business, corporations.
_
Reducing manufacturing and corporate costs.
_
Determining and improving the marketability of products and services.
_
Reducing consumer prices of products and services.
_
Improving and/or assuring on time deliveries and availability.
_
Assisting in the management of an enterprise.
6.5.5 Seven Tools for Quality Control
To make rational decisions using data obtained on the product, or process, or from the consumer,
organizations use certain graphical tools. These methods help us learn about the characteristics
of a process, its operating state of affairs and the kind of output we may expect from it. Graphical
methods are easy to understand and provide comprehensive information; they are a viable tool
for the analysis of product and process data. These tools are effect on quality improvement. The
seven quality control tools are:
1. Pareto charts 2. Check sheets 3. Cause and effect diagram
4. Scatter diagrams 5. Histogram 6. Graphs or flow charts
7. Control charts
|
 __ _________
_
_ ________
__
_____
_
1. P
ARETO CHARTS
Pareto charts help prioritize by arranging them in decreasing order of importantce. In an environment
of limited resources these diagrams help companies to decide on the order in which they should
address problems. The Pareto analysis can be used to identify the problem in a number of forms.
(a) Analysis of losses by material (number or past number).
(b) Analysis of losses by process i.e., classification of defects or lot rejections in terms of
the process.
(c) Analysis of losses by product family.
(d) Analysis by supplier across the entire spectrum of purchases.
(e) Analysis by cost of the parts.
(f) Analysis by failure mode.
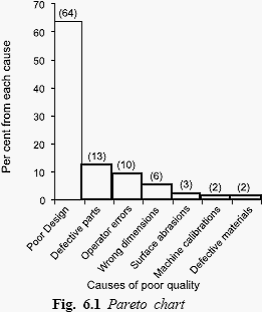
Example: The Fig. 6.1 shows a Pareto chart of reasons for poor quality. Poor design will
be the major reason, as indicated by 64%. Thus, this is the problem that the manufacturing unit
should address first.
A — Poor Design B — Defective Parts
C — Operator Error D — Wrong Dimensions
E — Surface Abrasion F — Machine Calibrations
G — Defective Material
2. CHECK SHEETS
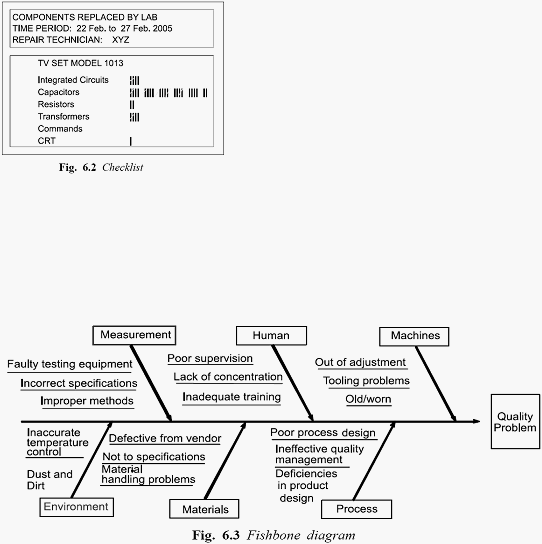
Check sheets facilitate systematic record keeping or data collection observations are recorded as
they happen which reveals patterns or trends. Data collection through the use of a checklist is
often the first step in analysis of quality problem. A checklist is a form used to record the
frequency of occurrence of certain product or service characteristics related to quality. The
characteristics may be measurable on a continuous scale such as weight, diameter, time or length.
|
 _______ __
____
___
Example: The table is a check sheet for an organization’s computer related problems.
Fig. 6.2 Checklist
3. CAUSE AND EFFECT DIAGRAM
It is sometimes called as Fish-bone diagram. It is first developed by Kaorv Ishikawa in 1943 and
is sometimes called as Ishikawa diagram. The diameter helps the management trace customer
complaints directly to the operations involved. The main quality problem is referred to Fish-head;
the major categories of potential cause structural bones and the likely specific causes to ribs. It
explores possible causes of problems, with the intention being to discover the root causes. This
diagram helps identify possible reasons for a process to go out of control as well as possible
effects on the process.
Fig. 6.3 Fishbone diagram
4. SCATTER DIAGRAM (SCATTER PLOTS)
It often indicates the relationship between two variables. They are often used as follow-ups to
a cause and effect analysis to determine whether a stated cause truly does impact the quality
characteristics.
|
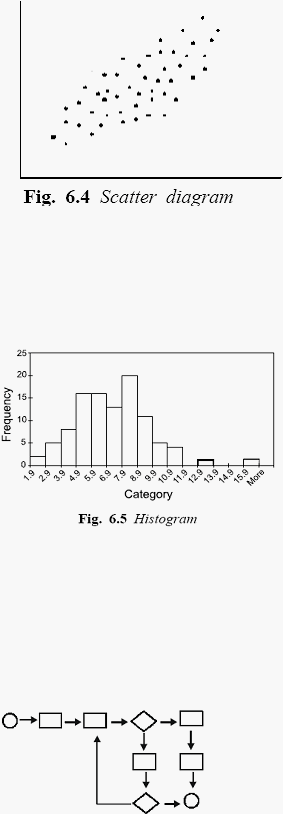 Example: The above figure plots advertising expenditure against company sales and indicates
a strong positive relationship between the two variables. As the level of advertising expenditure
increases sales tend to increase.
5. H
ISTOGRAM
(
OR
) B
AR CHARTS
It displays the large amounts of data that are difficult to interpret in their raw form. A histogram
summarizes data measured on a continuous scale showing the frequency distribution of some
quality characteristics (in statistical terms the central tendency and the dispersion of the data).
Often the mean of the data is indicated on the histogram. A bar chart is a series of bare
representing the frequency of occurrence of data characteristics, the bar height indicates the
number of times a particular quality characteristic was observed.
6. FLOW CHARTS (
OR
) GRAPHS
It shows the sequence of events in a process. They are used for manufacturing and service operations.
Flow charts are often used to diagram operational procedures to simplify the system. They can identify
bottlenecks, redundant steps and non-value added activities. A realistic flow chart can be constructed
by using the knowledge of the person who are directly involved in the particular process. The flow
chart can be identifies where delays can occur.
_______ __
____
___
|
 7. CONTROL CHARTS
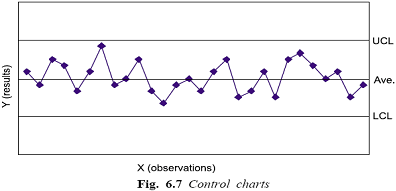
It distinguish special causes of variations from common causes of variation. They are used to
monitor and control process on an ongoing basis. A typical control chart plots a selected quality
characteristic found from sub-group of observations as a function of sample number. Characteristics
such as sample average, sample range and sample proportion of non-conforming units are plotted.
The centre line on a control chart represents the average value of characteristics being plotted.
Two limits know as the upper control limit (UCL) and lower control limit (LCL) are also shown
on control charts. These limits are constructed so that if the process is operating under a stable
system of chance causes, the problem of an observation falling outside these limits is quite small.
Figure 6.7 shows a generalized representation of a control chart.
Control chart shows the performance of a process from two points of view. First, they show
a snapshot of the process at the moment the data are collected. Second, they show the process
trend as time progresses. Process trends are important because they help in identifying the outof-
control status if it actually exists. Also, they help to detect variations outside the normal
operational limits, and to identify the cause of variations. Fig. 6.7 shows a generalised representation
of a control chart.
6.5.6 Causes of Variation in Quality
The variation in the quality of product in any manufacturing process is broadly classified as:
(a) Chance causes
(b) Assignable causes.
(A) CHANCE
CAUSES
The chance causes are those causes which are inherit in manufacturing process by virtue of
operational and constructional features of the equipments involved in a manufacturing process.
This is because of—
1. Machine vibrations
2. Voltage variations
3. Composition variation of material, etc.
|
|
___ _________
_
_ ________
__
_____
_
They are difficult to trace and difficult to control, even under best condition of production.
Even though, it is possible to trace out, it is not economical to eliminate. The chance causes
results in only a minute amount of variation in process. Variation in chance causes is due to
internal factors only the general pattern of variation under chance causes will follow a stable
statistical distribution (normal distribution). Variation within the control limits means only random
causes are present.
(
B
) A
SSIGNABLE CAUSES
These are the causes which creates ordinary variation in the production quality.
Assignable cause’s variation can always be traced to a specific quality. They occur due to—
1. Lack of skill in operation
2. Wrong maintenance practice
3. New vendors
4. Error in setting jigs and fixtures
5. Raw material defects
Variation due to these causes can be controlled before the defective items are produced.
Any one assignable cause can result in a large amount of variation in process. If the assignable
causes are present, the system will not follow a stable statistical distribution. When the actual
variation exceeds the control limits, it is a signal that assignable causes extend the process and
process should be investigated.
6.6 STATISTICAL PROCESS CONTROL
Statistical process control (SPC) is the application of statistical techniques to determine whether
the output of a process conforms to the product or service design. It aims at achieving good
quality during manufacture or service through prevention rather than detection. It is concerned
with controlling the process that makes the product because if the process is good then the
product will automatically be good.
6.6.1 Control Charts
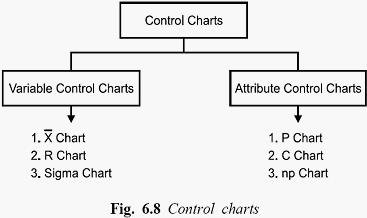
SPC is implemented through control charts that are used to monitor the output of the process and
indicate the presence of problems requiring further action. Control charts can be used to monitor
processes where output is measured as either variables or attributes. There are two types of
control charts: Variable control chart and attribute control chart.
1. Variable control charts: It is one by which it is possible to measures the quality
characteristics of a product. The variable control charts are X-BAR chart, R-BAR chart,
SIGMA chart.
2. Attribute control chart: It is one in which it is not possible to measures the quality
characteristics of a product, i.e., it is based on visual inspection only like good or bad, success
or failure, accepted or rejected. The attribute control charts are p-charts, np-charts, c-charts,
u-charts. It requires only a count of observations on characteristics e.g., the number of nonconforming
items in a sample.
|
 C
HARACTERISTICS OF CONTROL CHARTS
A control chart is a time-ordered diagram to monitor a quality characteristic, consisting of:
1. A nominal value, or centre line, the average of several past samples.
2. Two control limits used to judge whether action is required, an upper control limit (UCL)
and a lower control limit (LCL).
3. Data points, each consisting of the average measurement calculated from a sample taken
from the process, ordered overtime. By the Central Limit Theorem, regardless of the
distribution of the underlying individual measurements, the distribution of the sample
means will follow a normal distribution. The control limits are set based on the sampling
distribution of the quality measurement.
B
ENEFITS OF
U
SING CONTROL CHARTS
Following are the benefits of control charts:
1. A control chart indicates when something may be wrong, so that corrective action can
be taken.
2. The patterns of the plot on a control chart diagnosis possible cause and hence indicate
possible remedial actions.
3. It can estimate the process capability of process.
4. It provides useful information regarding actions to take for quality improvement.
O
BJECTIVES OF
C
ONTROL CHARTS
Following are the objectives of control charts:
1. To secure information to be used in establishing or changing specifications or in determining
whether the process can meet specifications or not.
2. To secure information to be used on establishing or changing production procedures.
3. To secure information to be used on establishing or changing inspection procedures or
acceptance procedures or both.
4. To provide a basis for current decision during production.
|
 5. To provide a basis for current decisions on acceptance for rejection of manufacturing or
purchased product.
6. To familiarize personnel with the use of control chart.
CONTROL CHARTS FOR VARIABLES
As the name indicates, these charts will use variable data of a process. X chart given an idea
of the central tendency of the observations. These charts will reveal the variations between
sample observations. R chart gives an idea about the spread (dispersion) of the observations. This
chart shows the variations within the samples.
X-Chart and R-Chart: The formulas used to establish various control limits are as follows:
(a) Standard Deviation of the Process,
, Unknown
R-Chart: To calculate the range of the data, subtract the smallest from the largest measurement
in the sample.
The control limits are: UCLR_D
4
RandLCLR_D3R
where R = average of several past R values and is the central line of the
control chart, and
D3
, D
4
= constants that provide three standard deviation (three-sigma)
limits for a given sample size
X -Chart: The control limits are:
UCLX = 2 2 X A RandLCL X A R X
where X = central line of the chart and the average of past sample mean’s, and
A2
= constant to provide three-sigma limits for the process mean.
(b) Standard Deviation of the Process,
, Known
Control charts for variables (with the standard deviation of the process,
, known) monitor
the mean, X , of the process distribution.
The control limits are:
UCL = X 2 X
and LCL = X 2 X
where X = centre line of the chart and the average of several past sample means, Z
is the standard normal deviate (number of standard deviations from
the average),
X
=
/ n and is the standard deviation of the distribution of sample means,
and n is the sample size
Procedures to construct X-chart and R-chart
1. Identify the process to be controlled.
|
 _______ __
____
___
2. Select the variable of interest.
3. Decide a suitable sample size (n) and number of samples to be collected (k).
4. Collect the specified number of samples over a given time interval.
5. Find the measurement of interest for each piece within the sample.
6. Obtain mean (X) of each sample.
7. Establish control limits for X and R-charts.
C
ONTROL CHARTS FOR
A
TTRIBUTES
P-charts and C-charts are charts will used for attributes. This chart shows the quality characteristics
rather than measurements.
P
-CHART
A p-chart is a commonly used control chart for attributes, whereby the quality characteristic
is counted, rather than measured, and the entire item or service can be declared good or
defective.
The standard deviation of the proportion defective, p, is:
p
= p
_
1
p
_
/n, where n = sample size, and p = average of several past p values and
central line on the chart.
Using the normal approximation to the binomial distribution, which is the actual distribution
of p,
UCL
p
= Z
p
p
and LCLp = Z
p
p
where z is the normal deviate (number of standard deviations from the average).
ILLUSTRATIONS ON X BAR CHART AND R BAR CHART
(i) Standard Deviation of the Process,
, Unknown
ILLUSTRATION 1: Several samples of size n = 8 have been taken from today’s
production of fence posts. The average post was 3 yards in length and the average sample
range was 0.015 yard. Find the 99.73% upper and lower control limits.
SOLUTION: X = 3 yds
R = 0.015 yds
A2
= 0.37 from Statistical Table
UCL = X
A²R
3
0.37(0.015)
3.006 yds
LCL = X
A2
R
3
0.37(0.015)
2.996 yds
ILLUSTRATION 2 (Problem on X and R Chart): The results of inspection of 10
samples with its average and range are tabulated in the following table. Compute the
control limit for the X and R-chart and draw the control chart for the data.
|
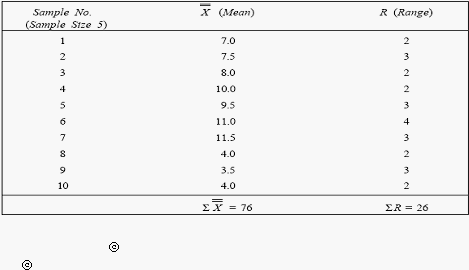 SOLUTION: X =
X /No. of samples
R =
R/No. of samples
Therefore, X =
76
10
= 7.6
R =
26
10
= 2.6
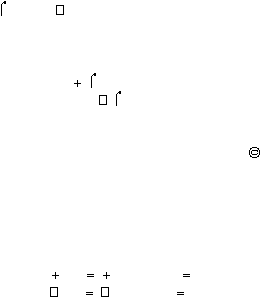
For X chart
Upper Control Limit (UCL) = X + A2 R
Lower Control Limit (LCL) = X – A
2 ®
For R chart
Upper Control Limit (UCL) = D
4
R
Lower Control Limit (LCL) = D3
R
The values of various factors (like A², D
4
and D³
) based on normal distribution can be found
from the following table:
A2
= 0.58, D3 = 0 and D
4
= 2.11
Thus, for X chart
UCL = 7.6 + (0.58 × 2.6)
|
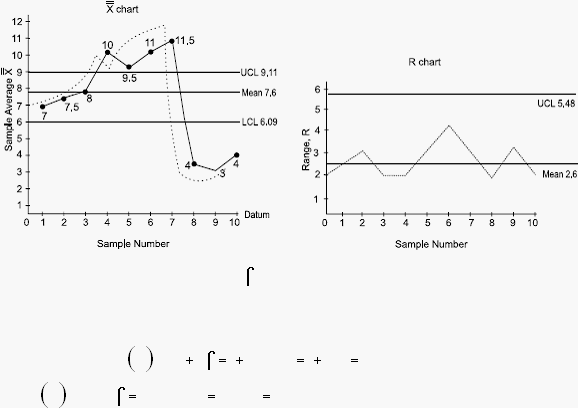 = 7.6 + 1.51 = 9.11
LCL = 7.6 – (0.58 × 2.6) = 6.09
For R chart UCL = 2.11 × 2.6 = 5.48
LCL = D3 × R = 0 × R = 0
These control limits are marked on the graph paper on either side of the mean value (line).
X and R values are plotted on the graph and jointed, thus resulting the control chart.
From the X chart, it appears that the process became completely out of control for 4th
sample over labels.
(ii) Standard Deviation of the Process,
, known
ILLUSTRATION 3: Twenty-five engine mounts are sampled each day and found to
have an average width of 2 inches, with a standard deviation of 0.1 inche. What are the
control limits that include 99.73% of the sample means (z = 3)?
SOLUTION: X
UCL
=
X
X
Z
2
3 0.1 25
2
0.06
2.06 inches
X
LCL =
X
X
Z
2
3 0.1 25
2
0.06
1.94 inches
ILLUSTRATION 4 (Problem on p-Chart): The following are the inspection results
of 10 lots, each lot being 300 items. Number defectives in each lot is 25, 30, 35, 40,
45, 35, 40, 30, 20 and 50. Calculate the average fraction defective and three sigma
limit for P-chart and state whether the process is in control.
|
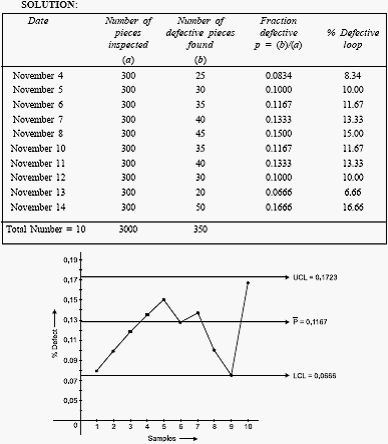 Upper Control Limit, UCL =
|
 Lower Control Limit, LCL = p
P P
n
3
1
_ _
where p =
Total number of defective pieces found
Total number of pieces inspected
p =
350
3000
= 0.1167
and n = number of pieces inspected every day
= 300
Therefore,
p p
n
_
1
_
=
0 1167 1 0 1167
300
. ×
_
.
_
=
0 1167 0 8333
300
. × .
= 0.01852
and 3
1
.
p p
n
_
_
= 0.01852 × 3 = 0.05556
Thus, UCL = 0.1167 + 0.05556 = 0.17226 = 0.1723 (Approx.)
LCL = 0.1167 – 0.05566 = 0.06114 = 0.0611 (Approx.)
Conclusion: All the samples are within the control limit and we can say process is under
control.
T
YPES OF
S
AMPLING
E
RRORS
There are two types of errors. They are type-I and type-II that can occur when making
inferences from control chart.
Type-I: Error or
-error or Level of Significance
Reject the hypothesis when it is true.
This results from inferring that a process is out of control when it is actually in control. The
|
 probability of type-I error is denoted by
, suppose a process is in control. If a point on the
control chart falls outside the control limits, we assume that, the process is out of control.
However, since the control limits are a finite distance (3
) from the mean. There is a small
chance about 0.0026 of a sample falling outside the control limits. In such instances, inferring the
process is out of control is wrong conclusion.
The control limits could be placed sufficiently far apart say 4 or 5
stand deviations on each
side of the central lines to reduce the probability of type-I error.
Type-II: Error or
-error
Accept the hypothesis when it is false.
This results from inferring that a process is in control when it is really out of control. If no
observations for outside the control limits we conclude that the process is in control while in
reality it is out control. For example, the process mean has changed.
___ _________
_
_ ________
__
_____
_
The process could out of control because process variability has changed (due to presence
of new operator). As the control limits are placed further apart the probability of type-II error
increases. To reduce the probability of type-II error it tends to have the control limits placed
closer to each other. This increases the probability of type-I error. Thus, the two types of errors
are inversely related to each other as the control limits change. Increasing the sample size can
reduce both
and
.
6.6.2 Acceptance Sampling
The objective of acceptance sampling is to take decision whether to accept or reject a lot based
on sample’s characteristics. The lot may be incoming raw materials or finished parts.
An accurate method to check the quality of lots is to do 100% inspection. But, 100%
inspection will have the following limitations:
_
The cost of inspection is high.
_
Destructive methods of testing will result in 100% spoilage of the parts.
_
Time taken for inspection will be too long.
_
When the population is large or infinite, it would be impossible or impracticable to inspect
each unit.
Hence, acceptance-sampling procedure has lot of scope in practical application. Acceptance
sampling can be used for attributes as well as variables.
Acceptance sampling deals with accept or reject situation of the incoming raw materials and
finished goods. Let the size of the incoming lot be N and the size of the sample drawn be n.
The probability of getting a given number of defective goods parts out a sample consisting of n
pieces will follow binomial distribution. If the lot size is infinite or very large, such that when a
sample is drawn from it and not replaced, then the usage of binomial distribution is justified.
Otherwise, we will have to use hyper-geometric distribution.
Specifications of a single sampling plan will contain a sample size (n) and an acceptance
number C. As an example, if we assume the sample size as 50 and the acceptance number as
3, the interpretation of the plan is explained as follows: Select a sample of size 50 from a lot and
obtain the number of defective pieces in the sample. If the number of defective pieces is less
than or equal to 3, then accept the whole lot from which the sample is drawn. Otherwise, reject
the whole lot. This is called single sampling plan. There are several variations of this plan.
In this process, one will commit two types of errors, viz., type-I error and type-II error. If
the lot is really good, but based on the sample information, it is rejected, then the supplier/
producer will be penalized. This is called producer’s risk or type-I error. The notation for this
error is
. On the other hand, if the lot is really bad, but it is accepted based on the sample
information, then the customer will be at loss. This is called consumer’s risk or type-II error. The
notation for this error is
. So, both parties should jointly decide about the levels of producer’s
risk (
) and consumer’s risk (
) based on mutual agreement.
|
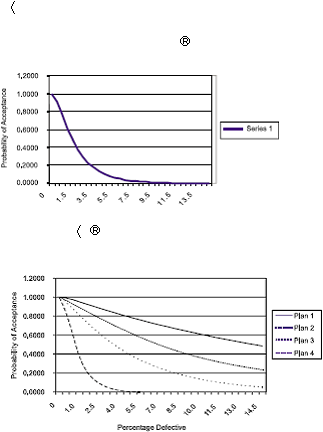 OPERATING CHARACTERISTIC CURVE (O.C. CURVE)
The concepts of the two types of risk are well explained using an operating characteristic curve.
This curve will provide a basis for selecting alternate sample plans. For a given value of sample
size (n), acceptance number (C), the O.C. curve is shown in Fig. 6.8.
_______ __
____
___
In Fig. 6.9, per cent defective is shown on x-axis. The probability of accepting the lot for
given per cent defective is shown on y-axis. The value for per cent defective indicates the
quality level of the lot inspected. AQL means acceptable quality level and LTPD indicates lot
tolerance per cent defectives. These represent quality levels of the lot submitted for inspection.
If the quality level of the lot inspected is at AQL or less than AQL, then the customers are
satisfied with the quality of the lot. The corresponding probability of acceptance is called
1 –
. On the other hand, if the quality level is more than or equal to LTPD, the quality of
the lot is considered to be inferior from consumer’s viewpoint. The corresponding probability
of acceptance of the lot is called
. The quality levelling between AQL and LTPD is called
indifferent zone.
Fig. 6.9 Operating characteristic curve
So, we require
,
, AQL and LTPD to design a sample plan. Based on these, one can
determine n and C for the implementation purpose of the plan.
Fig. 6.10 shows a various O.C. curves for different combinations of n and C.
|
 ___ _________
_
_ ________
__
_____
_
SINGLE SAMPLING PLAN
The design of single sampling plan with a specified producer’s risk and consumer’s risk is
demonstrated in this section. The required data for designing such plan are as follows:
(a) Producer’s Risk (
)
(b) Consumer’s Risk (b)
(c) Acceptable Quality Level (AQL)
(d) Lot Tolerance Per cent Defectives (LPTD)
The objective of this design is to find out the values for the sample size (n) and acceptance
number (C). The values for n and C are to be selected such that the O.C. curve passes through
the following two coordinates:
_
Coordinate with respect to the given
and AQL.
_
Coordinate with respect to the given
and LTPD.
But, the values of n and C should be integers. So, it will be very difficult to find n and C
exactly for the given parameters of the design. Hence, we will have to look for approximate
integer values for n and C such that the O.C. curve more or less passes through the above two
coordinates.
6.7 QUALITY CIRCLES
The quality circles begun in Japan in 1960s. The concept of quality circles is based on the
participating style of management. It assumes that productivity will improve through an uplift of
morale and motivations which are in turn achieved through consultation and discussion in informal
groups. One organizational mechanism for worker participation in quality is the quality circle. It
is typically an informal group of people that consists of operators, supervisors, managers and so
on who get together to improve ways to make the product or deliver the service.
According to Juran, quality circle defined as “a group of work force level people, usually
from within one department, who volunteer to meet weekly (on company time) to address quality
problems that occur within their department.”
Quality circle members select the problems and are given training is problem-solving
techniques. A quality circle can be an effective productivity improvement tool because it
generates new ideas and implements them. Where the introduction of quality circle is
capably planned and where the company environment is supporting they are highly
successful.
The benefits fall into two categories: those are measurable saving and improvement in the
attitudes and behaviour of people. Quality circles pursue two types of problems, those concerned
with the personal well being of the worker and those concerned with the well being of company.
6.7.1 Benefits of QC
The most important benefit of quality circles is their effect on people’s attitudes fall into three
categories
|
|
_______ __
____
___
1. Quality Circles Effect on Individual Characteristics
(a) Quality circles enable the individual to improve personal capabilities—group participation
and learning specific problem-solving tools.
(b) Quality circles increase the individual’s self-respect.
(c) Quality circles help worker change certain personality characteristics—shy person become
as active.
2. Quality Circles Effect on Individuals Relations with Other
(a) Quality circles increase the respect of the supervisor for the worker.
(b) Quality circles increase workers understanding of the difficulties faced by supervisors—
problem selection, solving and implementations.
(c) Quality circle increase management’s respect for worker.
3. Quality Circles Effect on Workers and Their Attributes
(a) Quality circles change some workers negative attitudes.
(b) Quality circle reduces conflict stemming from the working environment.
(c) Quality circles help workers to understand better the reasons while many problems
solved quickly.
Quality circles, as a management tool, are based on the following basic principles of
people:
(a) People want to do a good job.
(b) People want to be recognized as intelligent, interested employees and to participate in
decisions affecting their work.
(c) People want information to better understand goals and problems of their organization
and make informed decisions.
(d) Employees want recognition and responsibility and a feeling of self-esteem.
Motivational methods are not enough for successful quality circle programs. Management
support, technical knowledge, and statistical procedures are essential.
6.8 TOTAL QUALITY MANAGEMENT
Now-a-days, customers demand products/services with greater durability and reliability at the
most economic price. This forces producers to strictly follow quality procedures right from design
till shipment and installation of the products. So that goal of any competitive industry is to provide
a product or service at the most economical costs, ensuring full customer satisfaction. This can
be achieved through Total Quality Management (TQM), because, quality is not a technical
function, but a systemic process extending throughout all phases of the business, e.g., marketing,
design, development, engineering, purchasing, production/operations.
As per Feigebaum, “Total Quality Management is an effective system of integrating the
quality development, quality maintenance and quality improvement efforts of various groups in an
organization so as to enable marketing, engineering, production and service at the most economical
levels which allow for full customer satisfaction”.
|
|
___ _________
_
_ ________
__
_____
_
6.8.1 Benefits of TQM
The benefits of TQM can be classified into the following two categories:
1. Customer satisfaction oriented benefits.
2. Economic improvements oriented benefits.
1. Customer satisfaction oriented benefits: The benefits under this category are listed below:
(a) Improvement in product quality.
(b) Improvement in product design.
(c) Improvement in production flow.
(d) Improvement in employee morale and quality consciousness.
(e) Improvement of product service.
(f) Improvement in market place acceptance.
2. Economic improvements oriented benefits: The benefits under this category are as
follows:
(a) Reductions in operating costs.
(b) Reductions in operating losses.
(c) Reductions in field service costs.
(d) Reductions in liability exposure.
6.9 ISO 9000 SERIES
ISO stands for International Organization for Standardization. It is an international body, which
consists of representatives from more than 90 countries. The national standard bodies of these
countries are the members of this organization. Bureau of Indian Standards (BIS) are the Indian
representative to ISO, ISO and International Electro Technical Commission (IEC)) operate jointly
as a single system. These are non-governmental organizations, which exist to provide common
standards on international trade of goods and services.
ISO 9000 standards expect firms to have a quality manual that meets ISO guidelines,
documents, quality procedures and job instructions, and verification of compliance by third-party
auditors. ISO 9000 series has five international standards on quality managements. They are:
1. ISO 9000 — Quality management and Quality assurance standards
2. ISO 9001 — Quality systems: Quality in design
3. ISO 9002 — Quality systems: Production and Installation
4. ISO 9003 — Quality systems: Final inspection and test
5. ISO 9004 — Quality management and systems
6.9.1 Objectives of ISO 9000 Series
The objectives of ISO 9000 series is listed in Table 6.1.
|
|
TABLE 6.1: ISO 9000 series
Standard Objectives/Tasks
ISO 9000 This provides guidelines on selection and use of quality management and quality assurance
standards.
ISO 9001 It has 20 elements covering design, development, production, installation and servicing.
ISO 9002 It has 18 elements covering production and installation. It is same as ISO 9001 without the
first two tasks, viz., design and development. This is applicable for the units excluding R
& D functions.
ISO 9003 It has 12 elements covering final inspection and testing for laboratories and warehouses etc.
ISO 9004 This provides guidelines to interpret the quality management and quality assurance. This
also has suggestions which are not mandatory.
6.9.2 Benefits of ISO 9000 Series
ISO 9000 series provides several tangible and intangible benefits which are listed below:
1. This gives competitive advantage in the global market.
2. Consistency in quality, since ISO helps in detecting non-conformity early which makes
it possible to take corrective action.
3. Documentation of quality procedures adds clarity to quality system.
4. ISO 9000 ensures adequate and regular quality training for all members of the organization.
5. ISO helps the customers to have cost effective purchase procedure.
6. The customers while making purchases from companies with ISO certificate need not
spend much on inspection and testing. This will reduce the quality cost and lead-time.
7. This will help in increasing productivity.
8. This will aid to improved morale and involvement of workers.
9. The level of job satisfaction would be more.
6.9.3 Steps in ISO 9000 Registration
1. Selection of appropriate standard from ISO 9001, ISO 9002 and ISO 9003 using the
guidelines given in ISO 9000.
2. Preparation of quality manual to cover all the elements in the selected model.
3. Preparation of procedures and shop floor instructions which are used at the time of
implementing the system. Also document these items.
4. Self-auditing to check compliance of the selected model.
5. Selection of a registrar and making application to obtain certificate for the selected model.
A registrar is an independent body with knowledge and experience to evaluate any one of
the three models of the company’s quality system (ISO 9002). Registrars are approved and
certified by acridities.
|
|
The registrar, on successful verification and assessment will register the company. Before
selecting a registrar, one should know the following:
1. Accreditors of the registrar.
2. Background and credibility of the registrar.
3. Cost of registration through the proposed registrar.
4. Expected harmony between the company and the potential registrar while working towards
implementing ISO model in the company.
6.10 APPLICATION ISO 9000: ISO 14000 SERIES
O
VERVIEW
The ISO 14000 series of environmental management standards are intended to assist organizations
manage the environmental effect of their business practices. The ISO 14000 series is similar to
the ISO 9000 series published in 1987. The purpose of the ISO 9000 series is to encourage
organizations to institute quality assurance management programs. Although ISO 9000 deals with
the overall management of an organization and ISO 14000 deals with the management of the
environmental effects of an organization, both standards are concerned with processes, and there
is talk of combining the two series into one.
Both series of standards were published by ISO, the International Organization for
Standardization. The purpose of ISO is to facilitate international trade and cooperation in commercial,
intellectual, scientific and economic endeavors by developing international standards. ISO originally
focused on industrial and mechanical engineering standards. Now, it has ventured into setting
standards for an organization’s processes, policies, and practices.
The environmental standards of ISO 14000 deal with how a company manages the
environment inside its facilities and the immediate outside environment. However, the standards
also call for analysis of the entire life cycle of a product, from raw material to eventual
disposal. These standards do not mandate a particular level of pollution or performance, but
focus on awareness of the processes and procedures that can effect the environment. It should
be noted that adherence to the ISO 14000 standards does not in anyway release a company
from any national or local regulations regarding specific performance issues regarding the
environment.
Some of the standards in the ISO 14000 series are:
_
ISO 14001—Specification of Environmental Management Systems
_
ISO 14004—Guideline Standard
_
ISO 14010 through ISO 14015—Environmental Auditing and Related Activities
_
ISO 14020 through ISO 14024—Environmental Labelling
_
ISO 14031 through ISO 14032—Environmental Performance Evaluation
_
ISO 14040 through ISO 14043—Life Cycle Assessment
_
ISO 14050—Terms and Definitions
|
|
_______ __
____
__
Although the ISO 14000 standards are similar to the ISO 9000 standards, the nature of the
environmental standards creates a need for people who are technical environment professionals
in addition to those required to maintain the documentation necessary for certification.
6.10.1 The Benefits of ISO 14000 Certification
The benefits of acquiring ISO certification go beyond the satisfaction of doing a good deed.
Adhering to the standard may result in better conformance to environmental regulations, greater
marketability, better use of resources, higher quality goods and services, increased levels of
safety, improved image and increased profits.
_
The environmental awareness and the documentation that are required by the ISO 14000
standards assist a company in conforming to environmental regulations. This means that
a company, by diligently adhering to the standard, is less likely to violate environmental
regulations and is always ready for inspection by a regulatory agency. In addition, the
certification and documentation may aid a company in acquiring capital, in defending itself
during environmental litigation and in receiving insurance or permits.
_
A wider market for a company’s goods and services may result from certification. Many
corporations and governments will be looking for suppliers that are ISO 14000 certified
in order to maintain their own certification and environment-friendly image.
_
Producers of consumer goods may find that many consumers not only try to purchase
goods from environment-friendly companies, but will spend a little more if they feel they
are helping the environment. In order to reap this benefit, a company must make their
environmental efforts known through advertising and labelling.
_
The process analyses that go along with ISO 14000 certification may result in streamlining
processes and more efficient use of resources and raw materials and subsequently
reduce a company’s costs.
_
Reducing the amount of potentially dangerous substances in an end product may result
in less use of dangerous chemicals in a plant. This leads to a safer internal environment
for employees and the possibility of reduced insurance premiums. Improved employee
morale may result when employees feel that the workplace is safer and they are
contributing to the environmental effort.
ANNEXURE–I
List of Certifying Bodies
The list of certification bodies with Quality Management System and Environmental
Management System for 9000 series is listed in the following tables:
|
|
___ _________
_
_ ________
__
_____
_
8. Mention different types of quality control.
9. What is statistical process control?
10. What is QC?
11. Mention two types of control charts.
12. Mention the characteristics of control charts.
13.
What is P-chart?
14. What do you mean by ‘quality circles’?
15. What do you mean by TQM?
16. Mention the five international standards of ISO 9000 series.
17. What is ISO?
Section B
1. What is inspection? Explain the purpose of inspection.
2. Explain the different methods of inspection.
3. Explain the steps in quality control process.
4. Explain the objectives of quality control.
5. Explain the cause of variation in quality.
6. What are the benefits of using control charts.
7. Explain the objectives of control charts.
8. Explain the benefits of TQM.
9. What are the benefits of ISO 9000 series?
10. What are the steps in ISO 9000 registration?
Section C
1. Discuss the different types of inspection.
2. Discuss the seven tools for quality control.
3. Discuss the fundamental factors affecting quality.
4. Discuss the ‘9 M’ ’s of quality of product or service.
Skill Development
FAST FOOD RESTAURANT VISIT: Get the information for the following questions:
1. Quality control technique adopted for raw material.
2. Maintenance of quality in the process of manufacture.
3. Method of quality control technique (i.e. inspection or sampling technique).
4. Quality control tools used (i.e. Pareto chart, Scatter diagram etc.)
5. Application of control charts (i.e. control charts for variable i.e. thickness and size of
pizza, and for attributes i.e. number of defects in process of manufacturing)
6. Types of errors in accepting or rejecting samples (i.e. accepting bad one and rejecting
good one or vice versa).
|
|
_______ __
____
___
7. Total quality Management approach for continual improvement of quality.
8. Quality standard certification obtained if any.
CASELET
The Roots of Quality Control in Japan: An Interview with W. Edwards Deming Dr.
Deming, you said it will take about thirty years for the United States to catch up with Japan.
This is a somewhat pessimistic view of the United States. Would you elaborate on this point?
I don’t really know how long it will take. I think it will take thirty years; it should take all
of thirty years. I don’t think America will catch up with Japan because, so far as I can see, the
Japanese system has the advantage over the American system. For example, consider the
principle of constancy of purpose, which is absolutely vital and is number one in my Fourteen
Points. It refers to planning for the future with constancy of purpose.
Now in America some companies certainly do have constancy of purpose, but most do not.
Most have a president who was brought in to improve the quarterly dividend. That’s his job; you
can’t blame him for doing it. He’ll be there a while, and then go on to some other place to raise the
quarterly dividend there. For instance, someone told me that there were five candidates for
president of one of the biggest and most famous of America’s companies. When one of them was
selected, the other four resigned from the company. Such a thing could not happen in Japan. So you
see, the American system is so set up that it cannot use the talents of its people. That’s very serious.
People cannot work for the company. They only get out their quota. You can’t blame a
person for doing the job that is cut out for him since he has to pay his rent and take care of his
family. You can’t blame him, but you can blame management for a situation in which people
cannot work for the company. An employee cannot remain on the job to find out for sure what
the job is. The foreman does not have time to help him. As a matter of fact, the foreman may
decide a particular person cannot do the job at all and perhaps should be let go. People report
equipment out of order and nothing happens. If someone reports equipment out of order more
than three or four times, that person is considered a troublemaker. If he tries to find out more
about the job from the-foreman, he is considered a troublemaker. People find out that it is
impossible to do what is best for the company or do their best work for the company. They just
have to carryon as best they can, given the handicaps.
In addition, people have to use materials that are not suited to the job, and this creates a
sense of desperation. There isn’t much they can do about it-if they report, or try to do something,
they are labeled troublemakers. This situation does not exist in Japan. There, everyone is willing
to help everyone else.
Dr. Deming, as you’ve mentioned, one of the Fourteen Points emphasizes constancy
of purpose. Personally, I learned a great deal from that. Could you elaborate a little more
on that point?
A good way to assess a company’s constancy of purpose is to evaluate the source of
ultimate authority in that company. To whom does the president of the company answer? Does
anybody own the company? Do the owners answer to the stockholders? The stockholders,
thousands of them, who want dividends-to whom do they answer? Do they answer to their
|
